
Over the past five years, the residential real estate corridors of Nassau, Suffolk, and Queens have functioned as a pressure cooker for broader macroeconomic tremors. From the pandemic-fueled suburban migration frenzy of 2021 to the severe monetary policy tightening of 2022-2023, and the structural “lock-in” normalization of 2024-2026, the tri-county market has rewritten traditional valuation metrics.
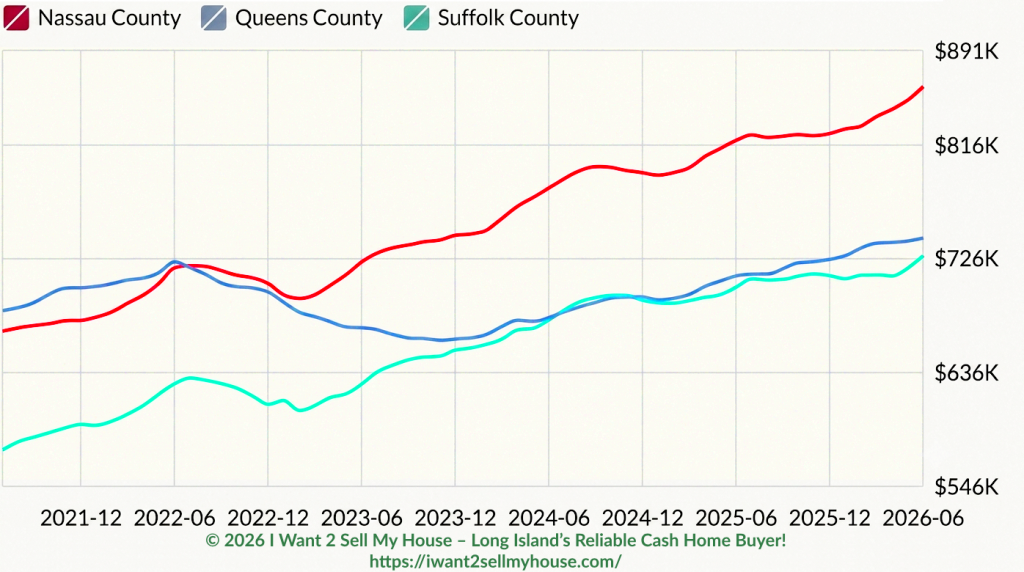
For real estate investors and home sellers, understanding this timeline is not merely an academic exercise, it is a map of where capital was forged, where liquidity froze, and where the next wave of opportunity lies.
Five-Year Data Matrix: County-by-County (2021–2026)
| Period / Milestone | Queens | Nassau | Suffolk | Primary Catalyst |
| July 2021Post-Lockdown Peak | $685,402 | $669,288 | $575,378 | Cheap mortgages and bidding wars. The 30-year mortgage rate was about 2.9%. OneKey MLS data showed Nassau’s median sale price had already increased from $525,000 to $600,000 in one year. Suffolk rose from $402,444 to $475,000. WABC reported that falling inventory produced bidding wars. A $500,000 mortgage at 2.87% cost about $2,073 per month in principal and interest, letting buyers bid more without raising their payment as sharply. Sources: WABC · Freddie Mac data |
| June 2022Inflation and Rate Shock | $724,287 | $719,406 | $627,743 | Inflation reached 9.1%, and the Fed raised rates by 0.75 percentage points in June. The 30-year mortgage rate reached 5.70% on June 30, compared with 2.98% one year earlier. Payments on a $500,000 mortgage increased from about $2,103 to $2,902, an extra $799 per month, before taxes and insurance. Buyers lost purchasing power, but prices remained high because inventory was still limited and many June closings reflected contracts signed earlier.Sources: BLS · Federal Reserve · Freddie Mac |
| February 2023Correction Trough | $684,265 | $695,193 | $606,395 | Sales fell much harder than prices. The 30-year rate reached 6.50% on February 23, compared with 3.89% one year earlier. A $500,000 mortgage now costs about $3,160 per month. HUD found that Long Island recorded about 31,500 sales during the 12 months ending March 2023, down 27% from 43,400, yet average prices were still 9% higher. Buyers pulled back, but many low-rate owners also refused to sell. That prevented a larger price decline. Sources: Freddie Mac · HUD Long Island report |
| September 2024Supply-Driven Resurgence | $692,112 | $799,225 | $695,695 | Rates declined, but available homes remained scarce. Mortgage rates fell to about 6.2%, down from 7.79% in October 2023. FHFA estimated that mortgage lock-in prevented 1.72 million U.S. sales between Q2 2022 and Q2 2024 and raised prices by about 7% through reduced supply. Locally, Nassau’s single-family median reached $815,000, while Suffolk matched its record at $680,000. And 28 Long Island communities had typical starter-home values above $1 million. The New York Times also followed first-time buyer Lorena Waters, who wanted to remain in her childhood Long Island school district while competing in this market.Sources: CFPB · FHFA · Newsday · Long Island starter-home data |
| June 2026High-Price Normalization | $742,865 | $862,621 | $728,959 | Rates stabilized, but local supply remained below demand. New York’s statewide inventory increased 4.4% to 32,508 listings, while the statewide median price reached a record $475,000, up 8%. But Nassau and Suffolk had only 6,314 active listings, 7% fewer than a year earlier. Suffolk inventory fell 9.2%. OneKey MLS reported June single-family medians of $875,000 in Nassau, $750,000 in Suffolk and $880,000 in Queens. At a 6.49% rate, a $500,000 mortgage cost about $3,157 per month. Buyers remained active, but increasingly avoided overpriced or renovation-heavy properties. Sources: New York Post · Long Island Business News · OneKey MLS |
Chronological Breakdown: Economic Parallels and Market Mechanics
1. The Pandemic Apex (Mid-2021)
- The Environment: In July 2021, Queens ($685,402) and Nassau ($669,288) sat at parity as urban dwellers fled high-density rental units for suburban square footage. Suffolk lagged at $575,378, representing an affordable frontier for remote workers.
- The Drivers: Federal stimulus, institutional monetary easing, and corporate adoption of remote work policies created unprecedented purchasing power. Social priorities shifted entirely toward private outdoor space and home offices.
2. The Rate Shock and Correction (Mid-2022 to Early 2023)
- The Environment: By June 2022, prices ticked upward momentarily on momentum (Nassau at $719,406, Queens at $724,287) before reality set in. By February 2023, the market found a local bottom: Nassau corrected to $695,193, Queens to $684,265, and Suffolk to $606,395.
- The Drivers: To combat soaring post-pandemic inflation, the Federal Reserve executed the fastest monetary tightening cycle in decades, pushing 30-year fixed mortgage rates from near 3% toward 7%. Transaction volume plunged as buyers faced immediate affordability walls, though absolute price drops were cushioned by a severe lack of inventory.
3. The Supply Squeeze and Structural Lock-In (2024)
- The Environment: By September 2024, values broke past previous highs with astonishing divergence. Nassau surged to $799,225, Suffolk caught up aggressively to $695,695, while Queens experienced a flatter trajectory at $692,112.
- The Drivers: The “lock-in effect” took a stranglehold on the market. Homeowners holding sub 4% mortgages refused to list, starving the market of resale inventory. Suffolk County saw immense compression as buyers priced out of western Nassau pushed further east.
4. The 2026 Equilibrium & Current Reality
- The Environment: As of June 2026, Nassau County leads the pack at an imposing $862,621 median, with Queens at $742,865 and Suffolk at $728,959.
- The Drivers: Mortgage rates have plateaued in the mid-6% range. While affordability remains stretched, structural undersupply (hovering near 2 to 3 months of inventory against a balanced 5 to 6-month benchmark) continues to place a hard floor under asset values.
Strategic Takeaways
The Golden Rule of the Current Cycle: You date the rate; you marry the price. Waiting out the market for lower borrowing costs risks running into compounding price appreciation driven by chronic regional housing shortages.
- For Home Sellers:
The data proves that well-maintained, turn-key properties in Nassau and Suffolk retain immense pricing power. Because active inventory remains roughly 60% below pre-pandemic norms, sellers face minimal direct competition provided properties are priced realistically against current buyer borrowing limits rather than 2021 peak fantasies. - For Real Estate Investors:
Queens multi-family assets and Suffolk suburban conversions offer distinct yield opportunities. While Queens provides stable rental demand supported by renters priced out of Manhattan, Suffolk offers asymmetric upside as outer-ring suburbanization solidifies permanent roots. Capital should target properties where value-add renovations can bridge the gap between dated inventory and modern buyer expectations.
Sources:
https://www.zillow.com/home-values/2046/suffolk-county-ny
https://www.redfin.com/county/1996/NY/Suffolk-County/housing-market